Cellfinder: Harnessing the power of deep learning to map the brain
6 April 2020
The mission of the Sainsbury Wellcome Centre is to understand how the brain gives rise to behaviour. In pursuing that goal, we often find ourselves in a position where the tool we need has not yet been invented.
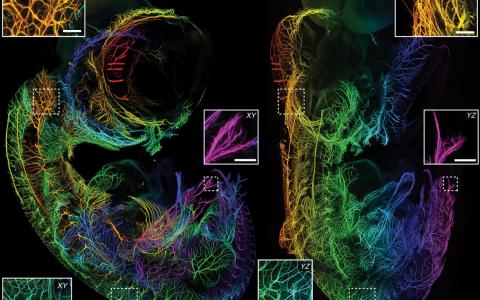
That was the case when the Margrie Lab wanted to map cells that provide input to different areas of the brain. While whole-brain imaging techniques have come far in recent years, the ability to analyse these images has lagged behind. Counting labelled cells manually is possible when there are only a few hundred, but when there are thousands in each brain it becomes practically impossible. The Margrie Lab wanted to produce a flexible tool that could be adapted to a variety of laboratory settings, allowing as many labs as possible to take advantage of recently developed whole-brain imaging tools.
To bridge the gap between imaging and analysis, Dr Christian Niedworok—then a PhD student in the Margrie Lab—set out to harness the power of deep learning to locate labelled cells in 3D whole-brain images through a tool called cellfinder. He developed a computer programme that detected labelled cells and assigned them a brain region by dividing the brain into structurally distinct areas. The programme was further developed by Dr Charly Rousseau and Dr Adam Tyson in the Margrie Lab, who helped make the software as automated and as easy to use as possible.
To test cellfinder, SWC labs have been using it to analyse their own data. It has already helped Dr Sepiedeh Keshavarzi and Dr Chryssanthi Tsitoura push their work beyond what was possible before. For years the Margrie Lab had been tracing how cells in the brain are connected, but usually in one area or cell type. Sepi and Chryssanthi wanted to capture connectivity on a much larger scale: an input connectivity map of the main cell types of the retrosplenial cortex, a brain region that is involved in spatial awareness and navigation. “What we wanted was to have a quantified map of the inputs and not just say, ‘oh we have some cells here, a lot of cells there, a few cells there.’ We wanted really quantifiable data,” Chryssanthi said.
To generate such a comprehensive dataset, they would need about 40 specimen brains, each of which would have taken about a month to analyse by hand. Aside from the prohibitive timescale, manual analysis done by one person produces a dataset prone to subjective errors, so it isn't necessarily comparable to other counters and brains. They needed a way to massively upscale their ability to analyse specimens.
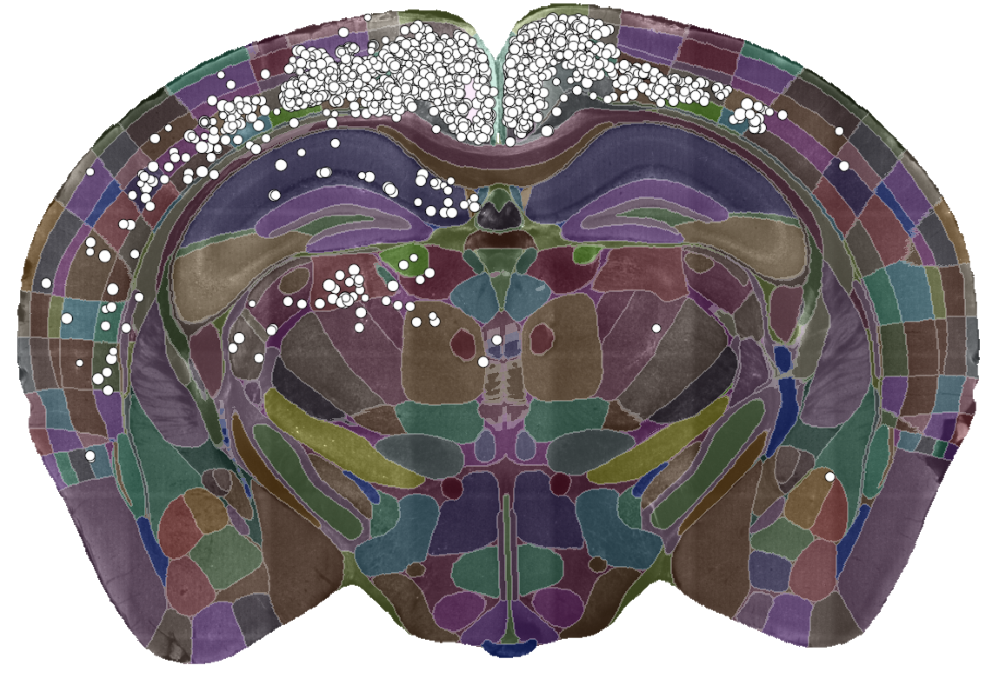
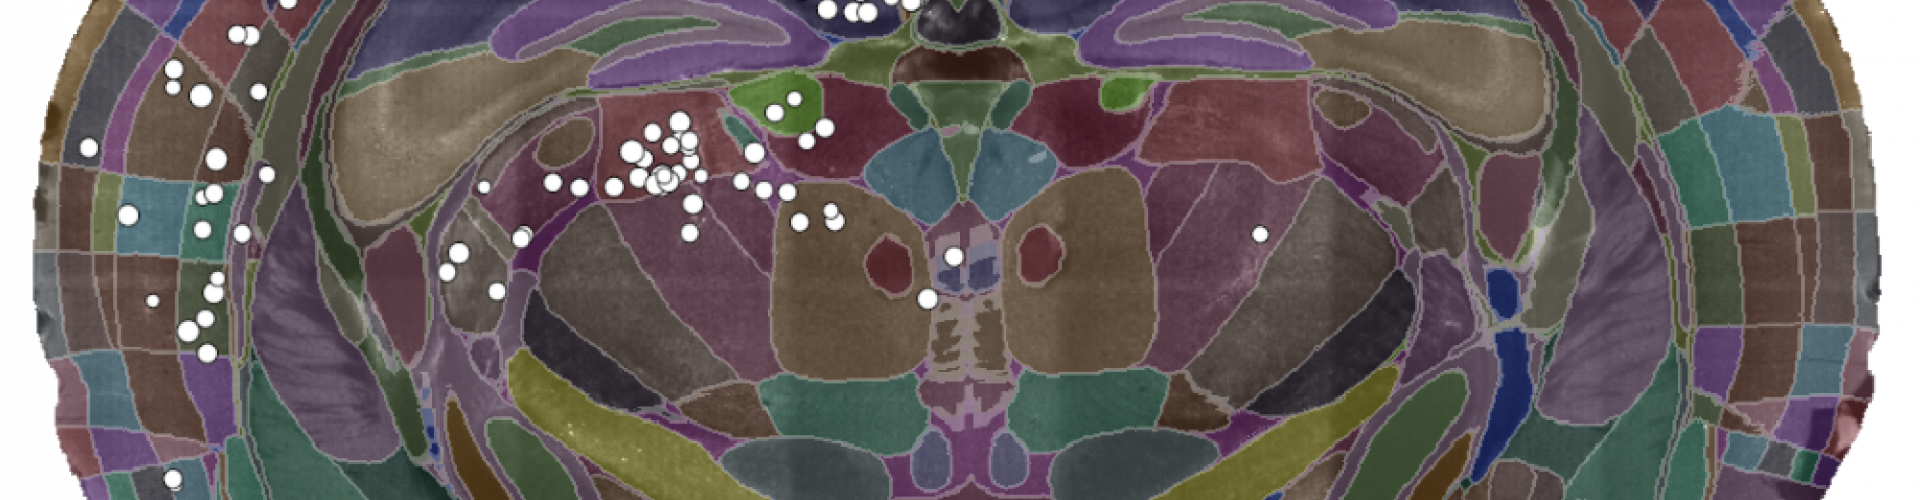
A single slice of a 3D brain image showing the detected cells (white dots) and the brain divided into regions (coloured sections). Data courtesy of Dr Sepiedeh Keshavarzi and Dr Chryssanthi Tsitoura.
Enter cellfinder. In contrast to hand counting, cellfinder can locate thousands of connected cells in a few hours (and it’s getting faster as it’s updated). Plus, the analysis is standardised across brains, which allowed Sepi and Chryssanthi to make direct comparisons across experiments.
In addition to allowing them to analyse more data than ever before, over two years Sepi and Chryssanthi’s work helped make cellfinder more effective. “Some things that are now fundamental parts of the programme actually came from us thinking they were important features,” Sepi explained.
According to Chryssanthi, one such contribution was the integration of software allowing data from different specimens to be easily compared. cellfinder was already capable of morphing the standard-bearer Allen Brain Atlas to fit a specimen and allow scientists to label brain areas and cells, but Sepi and Chryssanthi suggested the programme should be able to do the inverse as well. “If you think of the brain as a 3D space and you have the position of cells in 3D space at given coordinates, you need to have the brain areas match. Let’s say we have five animals and we see some differences in the input pattern to a given location. We want to know if there is animal-to-animal variation or whether our targeting of the injection site was variable, so we need a standard space to be able to directly compare.” Morphing specimen brains to the Allen Brain Atlas allows you to compare datasets across multiple animals.
After years of work on cellfinder the Sainsbury Wellcome Centre is excited to release it for general use. cellfinder has already been implemented in many labs worldwide and our hope is that the programme will only become more powerful and user-friendly through continued use, feedback and iteration. Anyone who wants to use cellfinder can find the software on GitHub. We’re particularly interested in hearing from those who want to use the programme for a new purpose, add additional functionality or integrate it with other tools. If that sounds like you, get in touch!